
Shih-Che Hsu, Research Fellow at UCL Energy Institute
Ian Hamilton, Associate Professor at UCL Energy Institute
Introduction
Excess winter mortality (EWM) is an important health issue for countries at middle and high latitudes. Exposure to low indoor temperature, accounting for the EWM, receives great attention (Jones, 2021). In England and Wales, EWM is much more serious than the situation in other countries of Europe (Clinch and Healy, 2001): about 28,300 extra deaths occurred in the winter months of 2019/20 in England and Wales (ONS, 2020). Moreover, the link between low indoor temperature and household energy consumption makes housing a critical contributing role in these extra deaths (Huebner et al., 2019). Poor property characteristics, household characteristics and energy performance characteristics each contribute to complex factors of inadequate protection from cold temperatures (Hamilton et al., 2017), and also cause higher energy demand at the same time (DECC, 2012). Understanding the determinants of low indoor temperature will benefit policy plans for implementing energy efficiency measures.
To investigate household temperature exposure, having a measure of indoor temperature is a key metric of the conditions being experienced. Information on indoor temperature within UK households has been collected through a number of studies (Vadodaria et al., 2014). The most recent and accessible survey is the Energy Follow-Up Survey (EFUS), which was a follow-up interview survey designed to understand how energy is used in the households of the 2010/2011 English Housing Survey (EHS). A subsequent survey was conducted in 2019/2020 but has not been released yet. The EFUS 2011 included a detailed survey on energy use practices and detailed energy using characteristics of the dwelling, along with the indoor comfort conditions of the home. In total, 2,616 homes were sampled to conduct interviews, and a further sub-sample of 823 homes to install temperature loggers, and 1,345 homes were selected to install meter readings (see below for further details).
In the 823 dwellings, temperature loggers recorded temperatures at 20-minute intervals and formed the key metrics (shown in Figure 1). The monthly daily mean, along with weekdays and weekend daily mean temperatures for each household were calculated respectively during that month. Weather data from the Met Office station closest to each household was time-matched, which provides the hourly external temperatures near the loggers.

Figure 1: Key metrics resulting from the temperature loggers data (Source: DECC, 2013)
Temperatures in English Households
The EFUS data shows that during the heating season (October to April), the mean room temperatures were 19.3°C for the living room, 18.8°C for the hallway and 18.9°C for the bedroom. There were no statistically significant differences in mean temperatures between weekday and weekend day in the living room, bedroom or the dwelling as a whole. Figure 2 illustrates the mean temperatures of three household zones compared with the external temperature. Living rooms had the highest mean monthly temperatures for October through to March, while mean monthly temperatures in the bedroom were the highest for the remaining months.
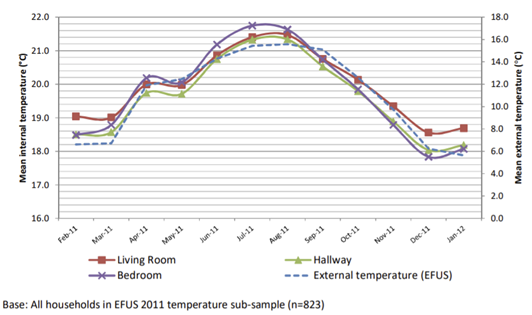
Figure 2: Monthly mean room temperatures and external temperature recorded during EFUS 2011 (Source: DECC, 2013)
The EFUS report (DECC, 2013) has shown that certain characteristics of the household and the building are associated with high indoor temperature in at least one zone. These characteristics are: (1) occupants are not under-occupying, (2) with someone in during the day during a weekday, (3) local authority or RSL dwellings, (4) household Reference Person (HRP) is older than 75 years, (5) with a pensioner living in, (6) with one or more persons retired, (7) floor area <50m2, (8) dwellings built between 1945 and 1990, and (9) double glazing, (10) flats, (11) in urban areas and London, (12) with at least one or more insulation measure.
Recent research by the UCL team used the EFUS data to examine wintertime indoor temperature. When the EFUS data was linked to household characteristics and energy performance characteristics in EHS, the results show that the income, age, employment status and vulnerability of households all affect wintertime indoor temperature. Energy performance characteristics (e.g., fuel poverty risk (using the 10% definition), fabric heat loss, energy performance rating, and window type) of households are also associated with low wintertime indoor temperature (Hamilton et al., 2017). Many English homes in winter were found to be colder than the recommended winter indoor temperature of 18°C, which might cause negative health outcomes (Huebner et al., 2018). Further analysis found that older buildings, detached homes, single occupancy and Northern England dwellings were the determinants of winter indoor temperatures below 18°C (Huebner et al., 2019).
Findings for Older English Households
In previous EFUS research, the age of Household Reference Person (HRP) is considered as one of the household characteristics affecting the mean indoor temperature, which is different from the focus of the HEEEAT project. In the HEEEAT project, the over 50 population is the group mainly targeted, because they are shown to be vulnerable groups to indoor temperature (PHE, 2014). For better understanding the difference in mean indoor temperature between the older people and the younger people, we compare the mean living room temperature between the two age groups (higher/less than 60) in wintertime and summertime. Figure 3 shows more older people have higher mean indoor temperatures in the heating season (January and February) whereas more younger people have higher mean indoor temperatures in the summertime (July and August). In line with previous research, both age and season are shown to affect the mean indoor temperatures distribution, as well as other household characteristics will vary the mean indoor temperature. The results have seen household characteristics affect the mean living room temperature within the older population but not in the younger population. It highlights the need for starting to focus on the older population and their household characteristics and energy performance.
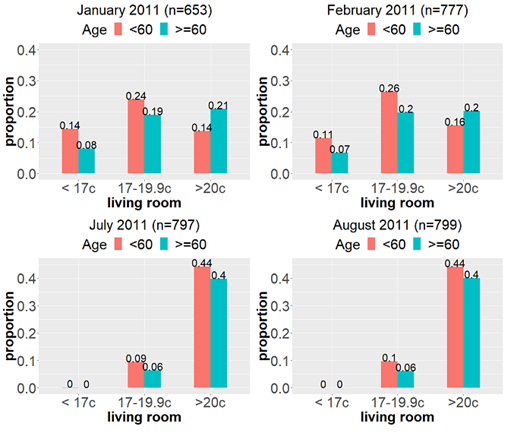
Figure 3: Monthly mean living room temperatures distribution for the older and younger age groups during wintertime and summertime of the EFUS 2011
EFUS Study Details
There are 11 reports published by the Department of Energy & Climate Change (now part of the Department for Business, Energy & Industrial Strategy) in January 2014 on the webpage of GOV.UK (https://www.gov.uk/government/statistics/energy-follow-up-survey-efus-2011). Among these reports, Report 2: Mean household temperatures, which focused specifically on the analysis of the mean dwelling temperatures, is similar to the focus of the HEEEAT project on indoor temperature monitoring. The EFUS results are representative of the English housing stock, with a population of 21.9 million households. By linking EFUS with the earlier English Housing Survey, the connection between household properties and monitored dwelling temperatures provides a much richer data source for analysis. The analysis was also used to update assumptions within energy models (BREDEM and SAP) and to inform energy efficiency policy.
References
- Clinch, J.P., Healy, J.D., (2001). Cost-benefit analysis of domestic energy efficiency. Energy Policy, 29, 113-124. https://doi.org/10.1016/S0301-4215(00)00110-5
- Department of Energy and Climate Change (2013). Report 2: Mean household temperatures. Energy Follow-Up Survey 2011, DECC, London, UK. https://www.gov.uk/government/statistics/energy-follow-up-survey-efus-2011
- Department of Energy and Climate Change (2014). Great Britain’s housing energy factfile Report 2011, DECC, London, UK. https://www.gov.uk/government/publications/great-britains-housing-energy-fact-file-2011
- Hamilton, I. G., O’Sullivan, A., Huebner, G., Oreszczyn, T., Shipworth, D., Summerfield, A., & Davies, M. (2017). Old and cold? Findings on the determinants of indoor temperatures in English dwellings during cold conditions. Energy and Buildings, 141, 142–157. https://doi.org/10.1016/j.enbuild.2017.02.014
- Huebner, G. M., Chalabi, Z., Hamilton, I., & Oreszczyn, T. (2019). Determinants of winter indoor temperatures below the threshold for healthy living in England. Energy and Buildings, 202, 109399. https://doi.org/10.1016/j.enbuild.2019.109399
- Huebner, G. M., Hamilton, I.G., Chalabi, Z., Shipworth, D., & Oreszczyn, T. (2018). Comparison of indoor temperatures of homes with recommended temperatures and effects of disability and age: an observational, cross-sectional study. BMJ Open, 8(5), e021085. https://doi.org/10.1136/BMJOPEN-2017-021085
- Jones, R. P., (2021). Excess Winter Mortality (EWM) as a Dynamic Forensic Tool: Where, When, Which Conditions, Gender, Ethnicity and Age. Int J Environ Res Public Health, 18(4), 2161. https://doi.org/10.3390/ijerph18042161
- Office for National Statistics. (2020). Excess winter mortality in England and Wales: 2019 to 2020 (provisional) and 2018 to 2019 (final). Retrieved May 10, 2021, from https://www.ons.gov.uk/peoplepopulationandcommunity/birthsdeathsandmarriages/deaths/bulletins/excesswintermortalityinenglandandwales/2019to2020provisionaland2018to2019final
- PHE (2014). Minimum home temperature thresholds for health in winter – A systematic literature review. Public Health England. https://assets.publishing.service.gov.uk/government/uploads/system/uploads/attachment_data/file/776497/Min_temp_threshold_for_homes_in_winter.pdf
- Vadodaria, K., Loveday, D.L., & Haines, V. (2014). Measured winter and spring-time indoor temperatures in UK homes over the period 1969–2010: A review and synthesis. Energy Policy, 64, 252-262. https://doi.org/10.1016/j.enpol.2013.07.062
